Understanding Transfer Functions
Running the Volume Renderer
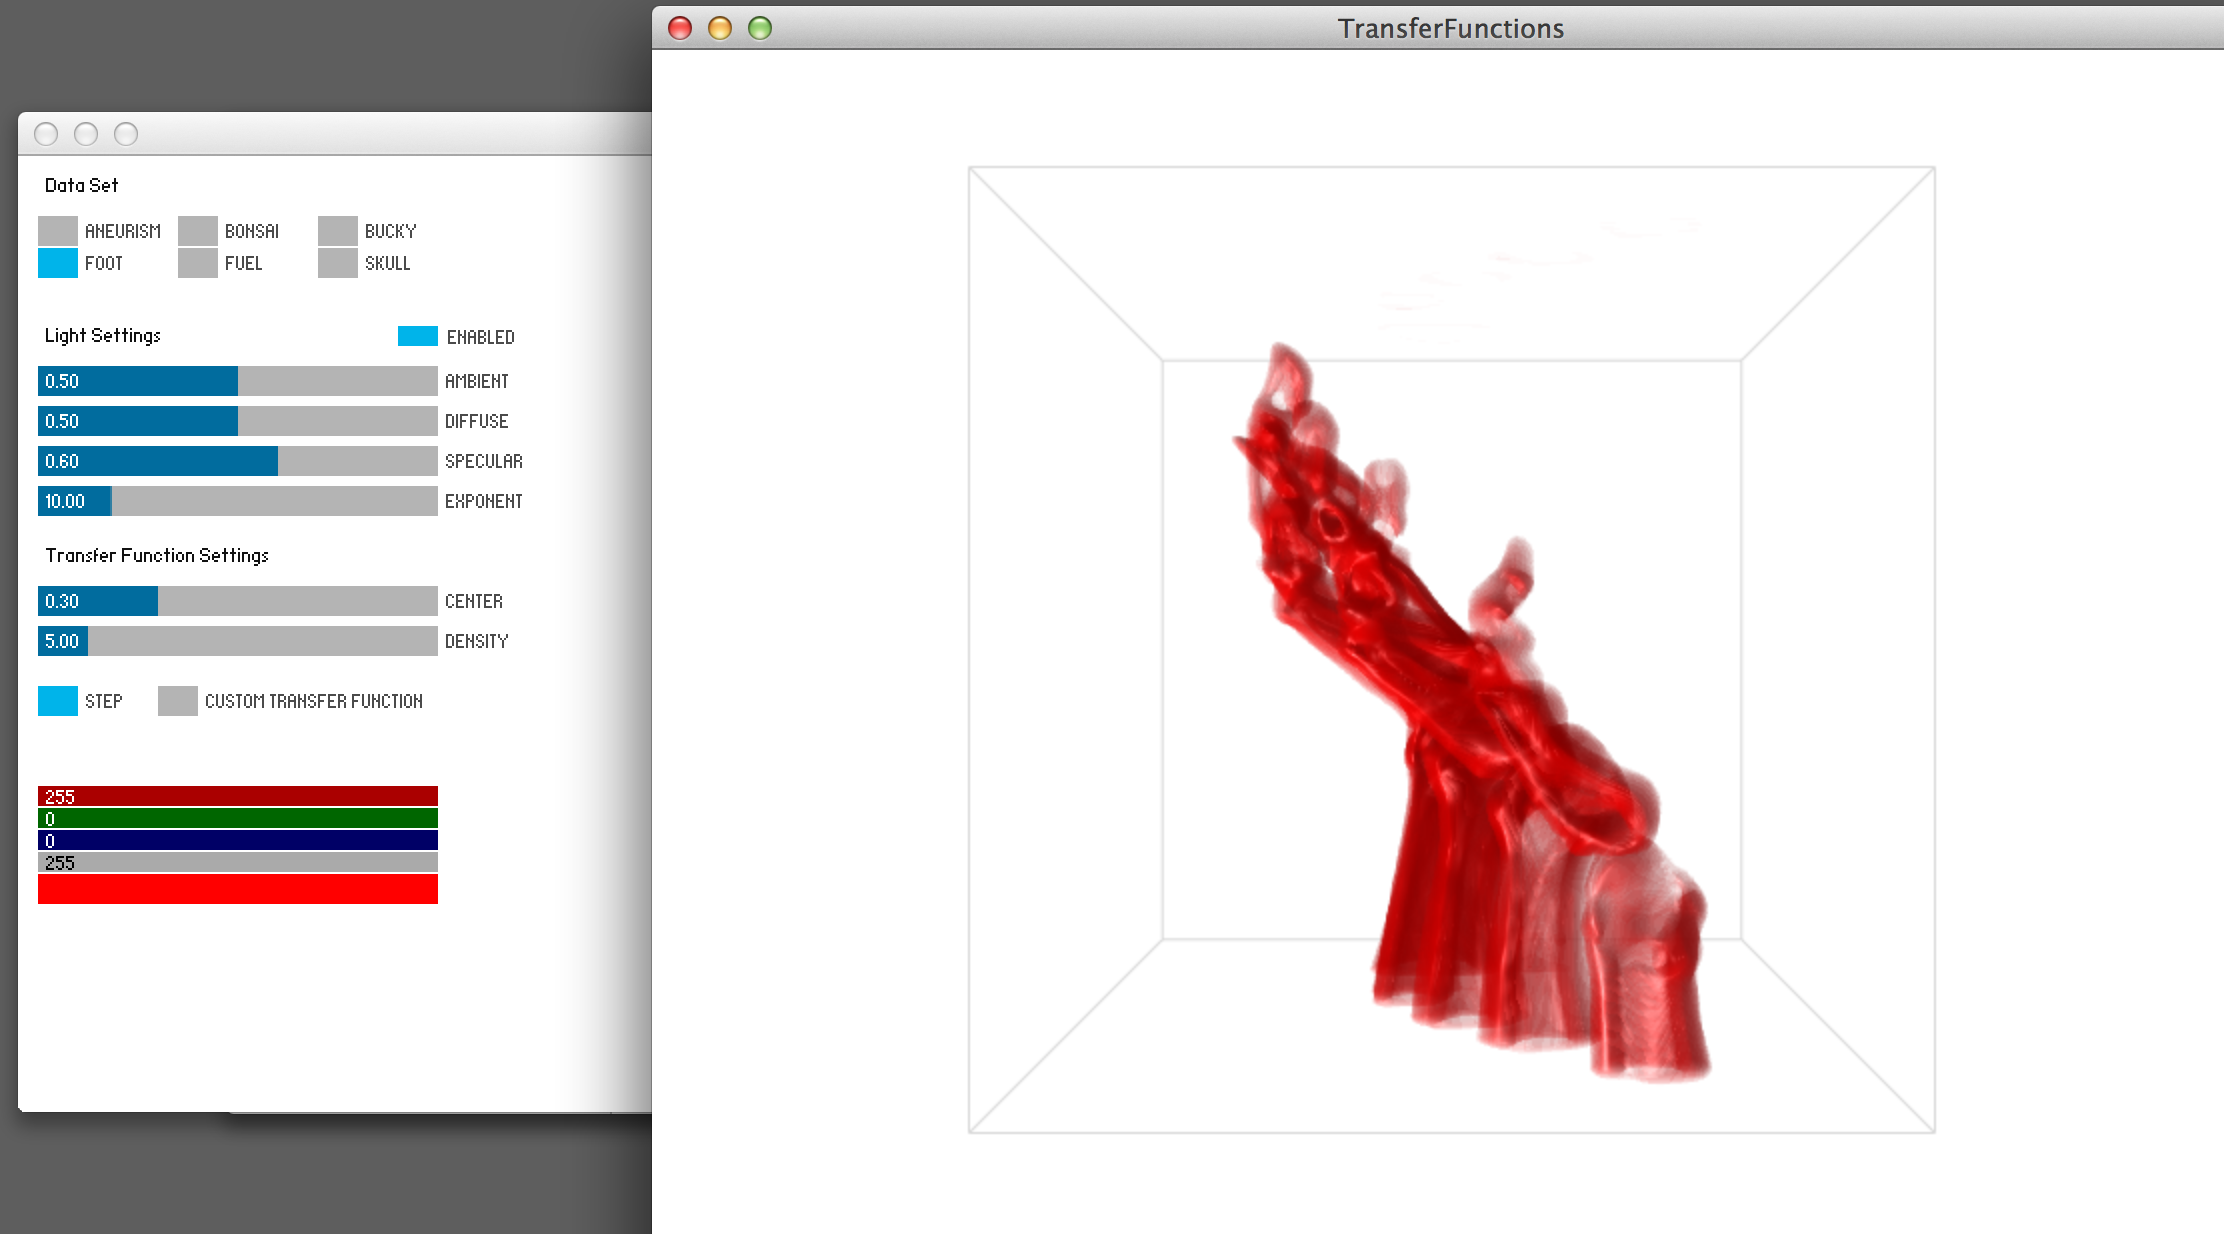
First, test the volume renderer as it is. You will need to download the assignment code as well as the latest version of Processing -- NOTE: this assignment requires you to be running Processing 2.1! If you have a slower computer, you may wish to go to the Engman lab as the volume renderer will rely on a fairly modern GPU; the computers in the Engman lab run the code well (see the data exploration assignment). Load this program up in Processing and run it. You should successfully get a screen as on the right.
Volume Visualization and Control Panel
In the volume rendering window, you can move the dataset around using
the left and right mouse keys + dragging. This style of panning and
zooming interaction is nearly universal for volume visualization
tools.
Code Structure
The main Processing sketch ( TransferFunctions.pde ) has very little code
because it calls two other files: one for rendering the volume
( VolumeRenderer.java ) and another for creating a control panel
( Controls.java ). For this assignment, you will only be required to edit
the control panel, and you are welcome to treat the rest of the code as a black-box
that just works. For those more experienced with Java, OpenGL, and GLSL, you are
welcome to explore more, if you wish, but be sure you complete the assignment.
If you have any difficulties, feel free to contact the TA.
Designing Your Own Transfer Function Widget
Now for the meat of the assignment: you will design your own 1D transfer function
widget. But first, you should take a step away from the code and go back to
pencil and paper. Think about different ways to represent and encode a 1D
transfer function. What controls will the user have access to? What user
interactions will exist to make it a useful widget? You may also wish to
consider the extra credit, at the end of the assignment. Try out multiple ideas,
sketch two or three possible widgets that are significantly different. Scan
each of your sketches into your digital notebook and explain how the
interactivity works in each.
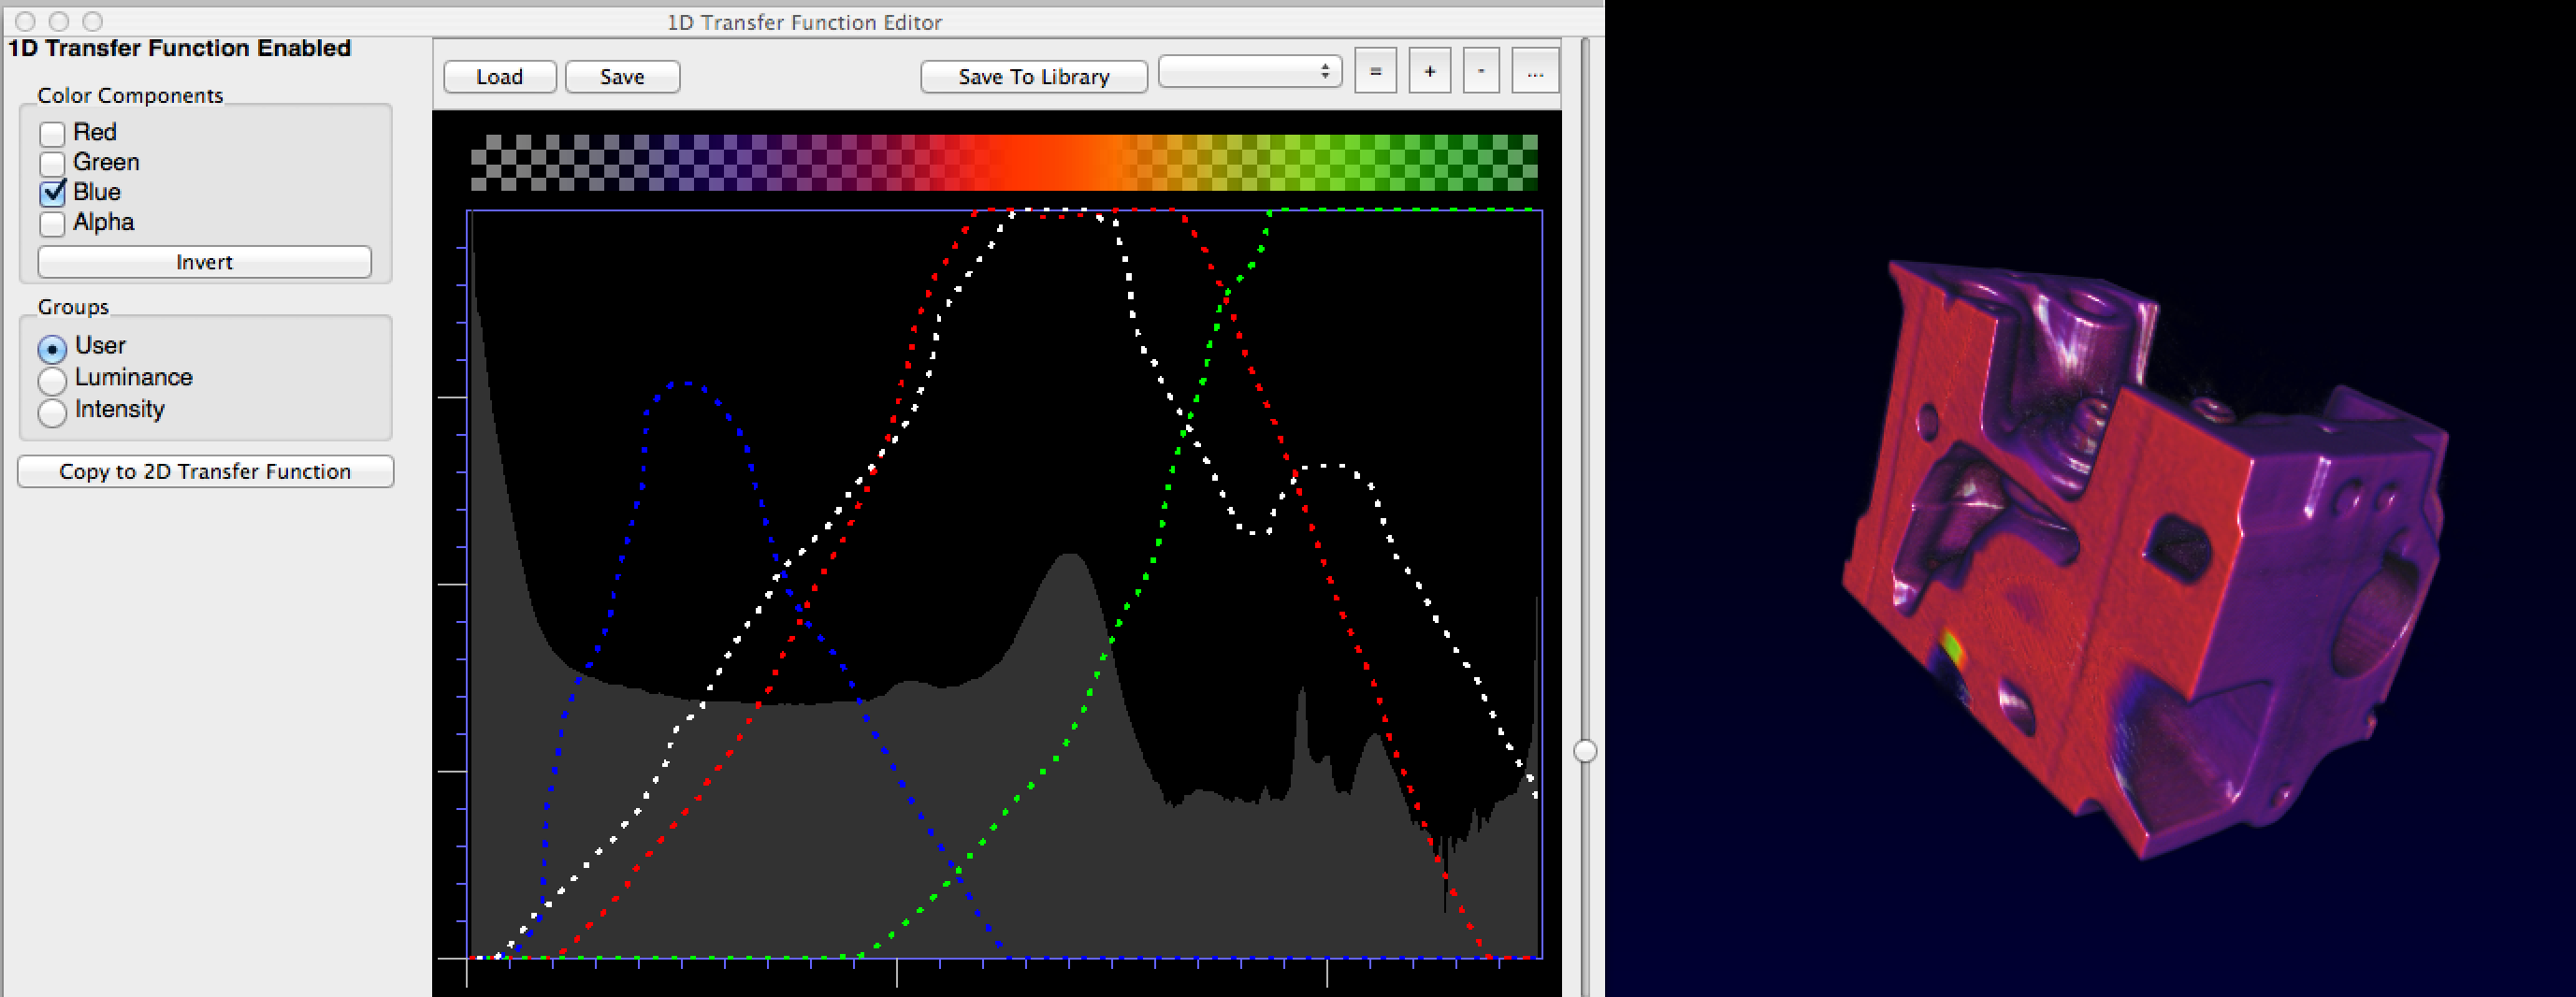
Note that most transfer function widgets give the users some context about the distribution of scalar values in the volume, ie. they often show histograms of the scalar values. These histograms can help a user to select appropriate colors and alpha values by targetting the most (or sometimes least) prevalant values. You may want to consider "scenting" your transfer function widget with a histogram.
Pick one to implement. You will be creating your widget so that it shows up on the empty, right-hand side of the Control Panel window. You will implement this widget using Processing code, and below we describe in detail where this code goes and what aspects of the existing data structures your widget must modify. The end result of your code will be to take the user input from your widget and use it to fill in the specific data structures in the code that specify the transfer function values (for both color and alpha).
Your widget code will go in Controls.java. In the next paragraphs we give details on how to use the code we have provided you. Include a screenshot of your interactive widget in your digital notebook and answer the following:
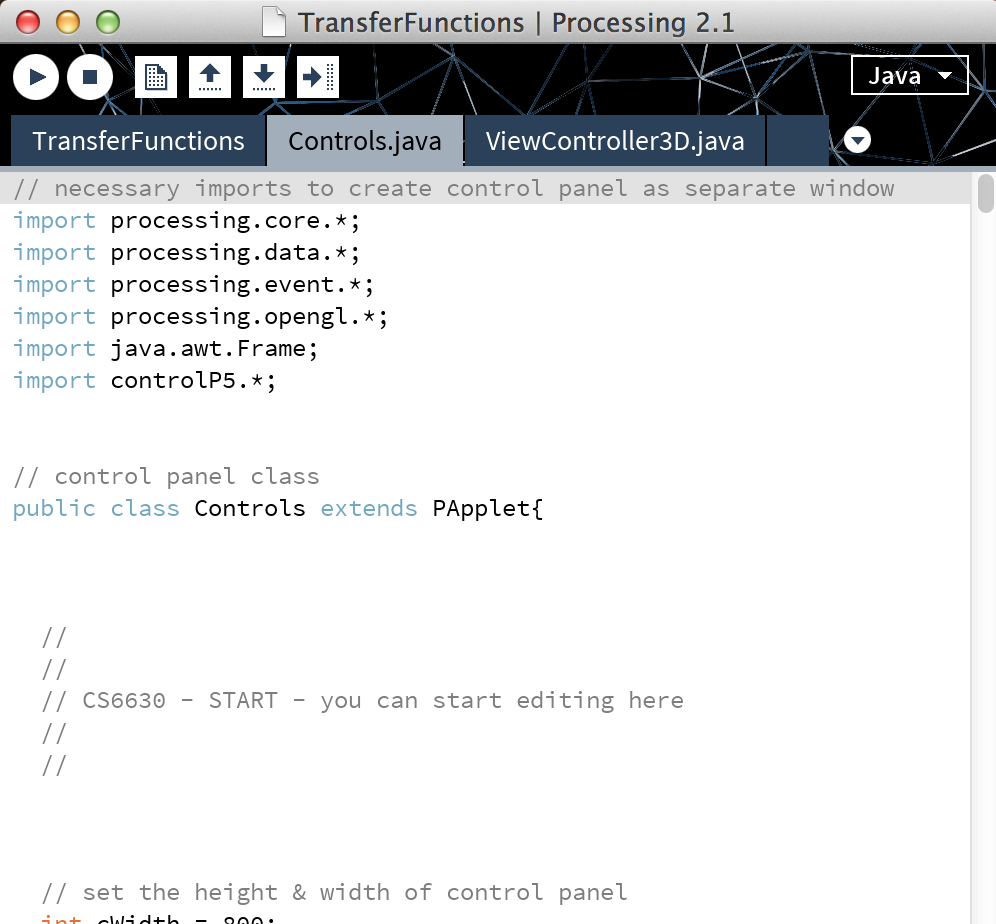
Details on Controls.java To aid with designing your widget, we have provided certain data structures for you to use. Again, be sure you are only editing in Controls.java, see right. Also, we have placed comments in that file, with the tag CS6630, to help you know where you should edit in-between. Unless you know what you are doing, we do not recommend editing code outside of there.
We have provided two variables, cWidth and cHeight, that will set the height and width of the control panel. The default elements of the control panel are set later in the file, but you should not need to edit them. The GUI of the control panel already gives you a button to switch between two transfer function modes. The second mode (custom transfer function) is the one you will use for your own widget.
We are also providing you with the volume data. First, an integer, gridSize, stores the number of data values on each edge of our 3D grid (which is uniform in all three dimensions). Also, data[x][y][z] is a 3D integer array that stores the scalar values of the volume, which have a range between 0 and 255. We also provide the min and max values for the current data set.
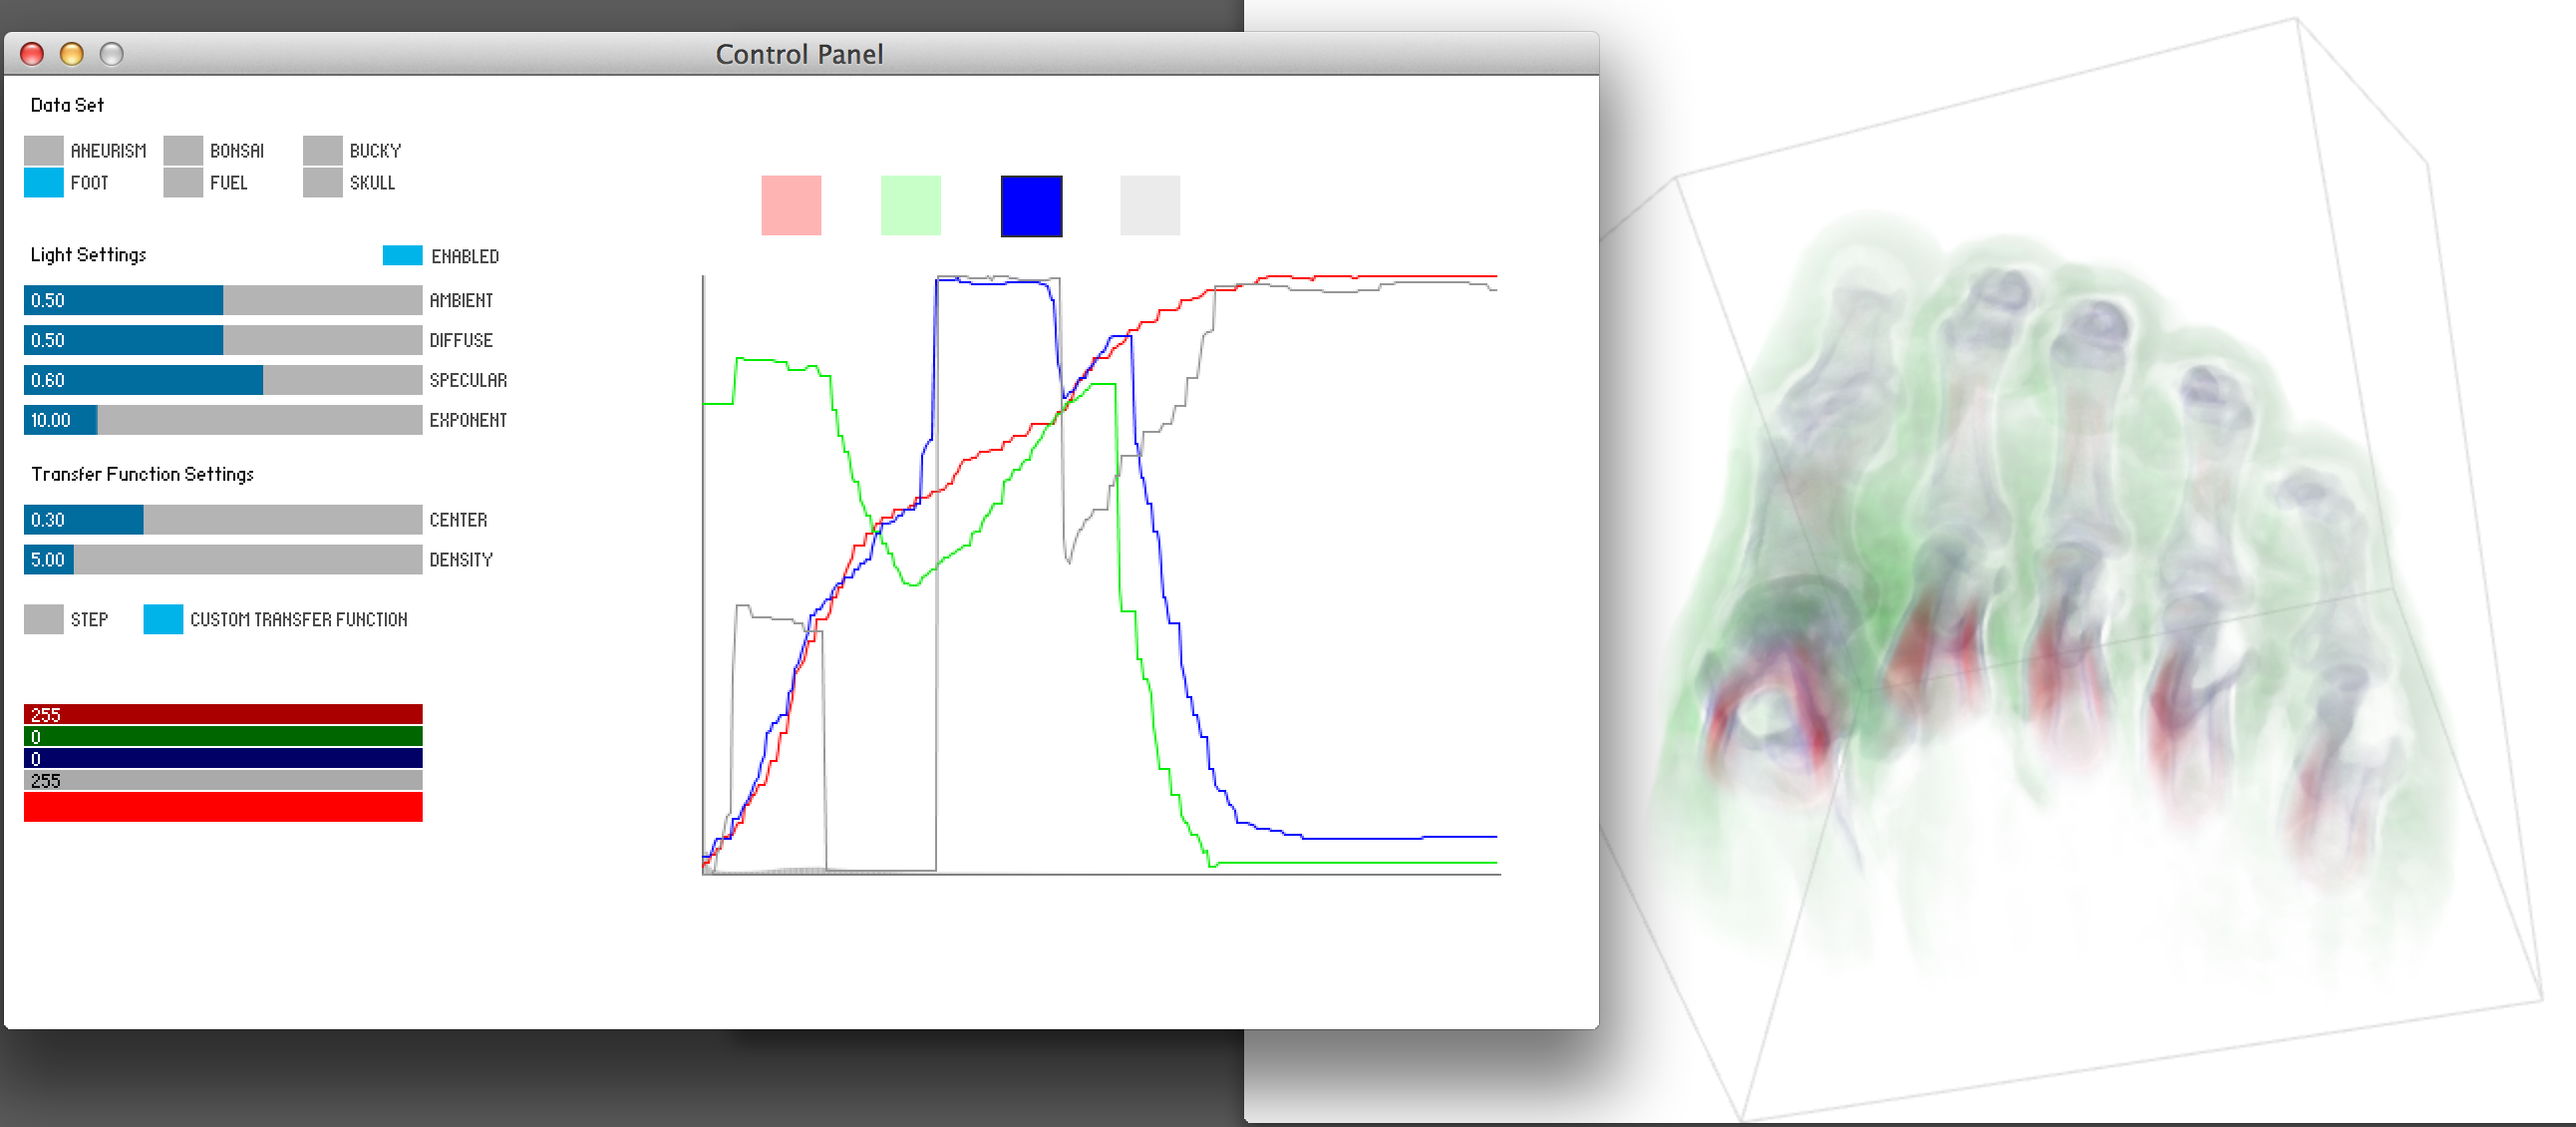
To define the transfer functions used by the volume renderer, your widget will need let the user set the color and alpha for each scalar value in the volume, and then fill in four different integer arrays with those values. These four arrays (red, green, blue, and alpha) each have a size of 256, which represents the scalar values 0-255. At each array element you'll need to set the appropriate color channel value for that scalar value. For example, if I want the scalar value of 10 to be transparent red, I'd set red[9]=255, green[9]=blue[9]=0, and alpha[9]=150. The color channel array values should be between 0 and 255. Thus, to find the color for the scalar value of 255, the volume renderer will check the following: red[255], green[255], blue[255], and alpha[255]. Please note that we have white backgrounds, so if all the RGB values are 0, then you are using the color black. However, the alpha channel is set so that values of 0 are transparent and values of 255 are solid. By default, the RGBA arrays are all transparent white.
If you are scenting your transfer function widget with a histogram of the scalar field values, then be aware that some of the data sets will be dominated by a single value -- this is quite common in volumes. These dominate values are most often uninteresting, such as the background or noise. You are free to "process" your histogram or display it in such a way that will minimize these dominate values. Please make sure to explain what you do in your notebook.
Like in Processing, the code has a setup() method. Do not remove or change the ordering of the initial setup calls. But, you are welcome to add more to the setup if you wish. We also have a draw() method, where the bulk of your widget will likely be written. Please note that there is a special function, updateTransferFunction(), which will pass your RGBA arrays in their current form and update the volume renderer with that data, if you are set to the proper transfer function mode (custom transfer function). You do not need to call this every draw cycle, but you must have a clear way to call this function in your widget in order to update the volume renderer with the user's transfer function.
Since you are writing in a Java file, there may be some quirks with using Processing commands. For example, to create a color, Java officially recognizes them as an int (not color!). Also, if you wish to write your own methods, you must be sure to specify them as public or private, like the setup() and draw() methods. You can do this for Processing methods that work like normal, like mouseClicked() or mouseDragged(). There may be more quirks, and, if you have trouble, feel free to contact the TA.
Finding Good Transfer Functions
Extra Credit
Design a 1D transfer function widget that uses a better perceptual color space for creating
more effective transfer functions. You are welcome to use HSV or HSL, if you wish, but
feel free to explore better color spaces, like Lab or HCL. What are the benefits of
using a more perceptually uniform color space in creating transfer functions? What are
the limitations or drawbacks of this approach?
If you choose to do this extra credit, you do not need to design your widget using RGBA -- you can start with this more advanced color space and complete the assignment with it.
Submission Details
As before, your digital notebook may be a PDF file, HTML webpage, or a URL to a
publicly available site or blog, such as a free
Blogger account.
The notebook should include screenshots of your visualization.
Also, you will be submitting your final Processing code for this assignment. Please ZIP up your entire project directory (code and data) to include in your submission. We expect to be able to run your visualization as is. You may either submit the code in Canvas, or host it online with a link to it in your digital notebook.
For the final submission in Canvas, please submit your digital notebook (PDF or ZIP) with your code (ZIP) or a link to your digital notebook (URL) which points to your code (ZIP).